
ROI Calculator and Project Return Planner
Calculate investment profit and return, compare two plans, and explore a project with timed cash flows. See transparent assumptions, charts and full calculations.
Build two ROI plans
Currency changes display only; there is no exchange-rate conversion.
Try an illustrative example
Plan A
Plan B
Enter the investment, all additional costs and all money received. For an asset, cash received includes sale proceeds and income; for a project, it is total cash revenue. Do not enter profit as revenue. These totals do not tell us when individual costs or receipts occur.
Annualization assumes all costs are paid at the start and all receipts arrive at the end. It is not a money-weighted return for interim cash flows. Zero duration or zero total cost has no annualized rate. Use the timed project below when cash-flow dates matter.
Your ROI results · Plan A
Cash received, costs and result
- Total cash received, including final value
- Total cash outlay
- Net profit or loss
The chart uses the selected currency, not percentages. Plan A and Plan B are separate illustrations, not performance rankings.
What makes up Plan A?
Compare both ROI plans
Compare similar assumptions and durations. A higher ROI alone does not establish lower risk or a better investment.
Work backwards from a target ROI
These targets use Plan A and the total-cost ROI definition. They do not predict what revenue is achievable. Minimum receipts are rounded up and maximum costs down to two decimal places; formulas retain unrounded values.
A negative additional-cost allowance means the initial investment alone exceeds the target cost limit.
How sensitive is the result?
Cautious means lower receipts and higher total costs; favorable means the reverse. Both cost components change together. These are illustrative scenarios, not probabilities or forecasts.
- Cautious
- Base
- Favorable
ROI when receipts and total costs change
Each cell shows ROI on its adjusted total cash outlay. Color indicates profit or loss only; it does not assess risk.
Build a timed cash-flow project
The upfront investment and upfront costs are paid at time zero. Include final sale or residual proceeds once, in the relevant receipt row. Use cash movements, not accounting depreciation. No taxes, financing charges or real-time prices are inserted automatically.
Enter up to 120 cash-flow rows at strictly increasing times, after the start and within 100 years. Receipts and costs are non-negative. All flows are assumed to occur at the entered time. Changing the time unit converts the dates without changing their timing.
This button distributes Plan A receipts and additional costs evenly per elapsed time, using the chosen time unit. A partial final period is included. It is an explicit assumption, not a reconstruction of actual transactions. Edit the rows to match your cash flows.
Timed project results
Payback is the first entered time when cumulative net cash flow covers the upfront outlay. No within-period interpolation or extrapolation is used. Discounted payback uses discounted cash flows. A larger discount rate does not change ordinary ROI.
Follow cash flow and recovery
Horizontal axis: elapsed years. Vertical axis: selected currency. Steps occur at the actual entered times; the chart does not invent continuous income between them.
Cash-flow calculation table
The table includes the upfront outlay at time zero and every entered row. Present values use the assumed effective annual discount rate and the elapsed time in years.
See the full calculation
Plan A · Timed project results
P = Initial investment; C = Additional costs over the whole period; K = Total cash outlay; R = Total cash received, including final value; G = Net profit or loss; T = Duration; q = Target ROI on total costs (%); r = Assumed annual discount rate (%); CF_j = Net cash flow; t_j = Elapsed time; PV_j = Present value; B_j = Cumulative net cash flow; I_0 = Initial project investment + Other upfront costs.
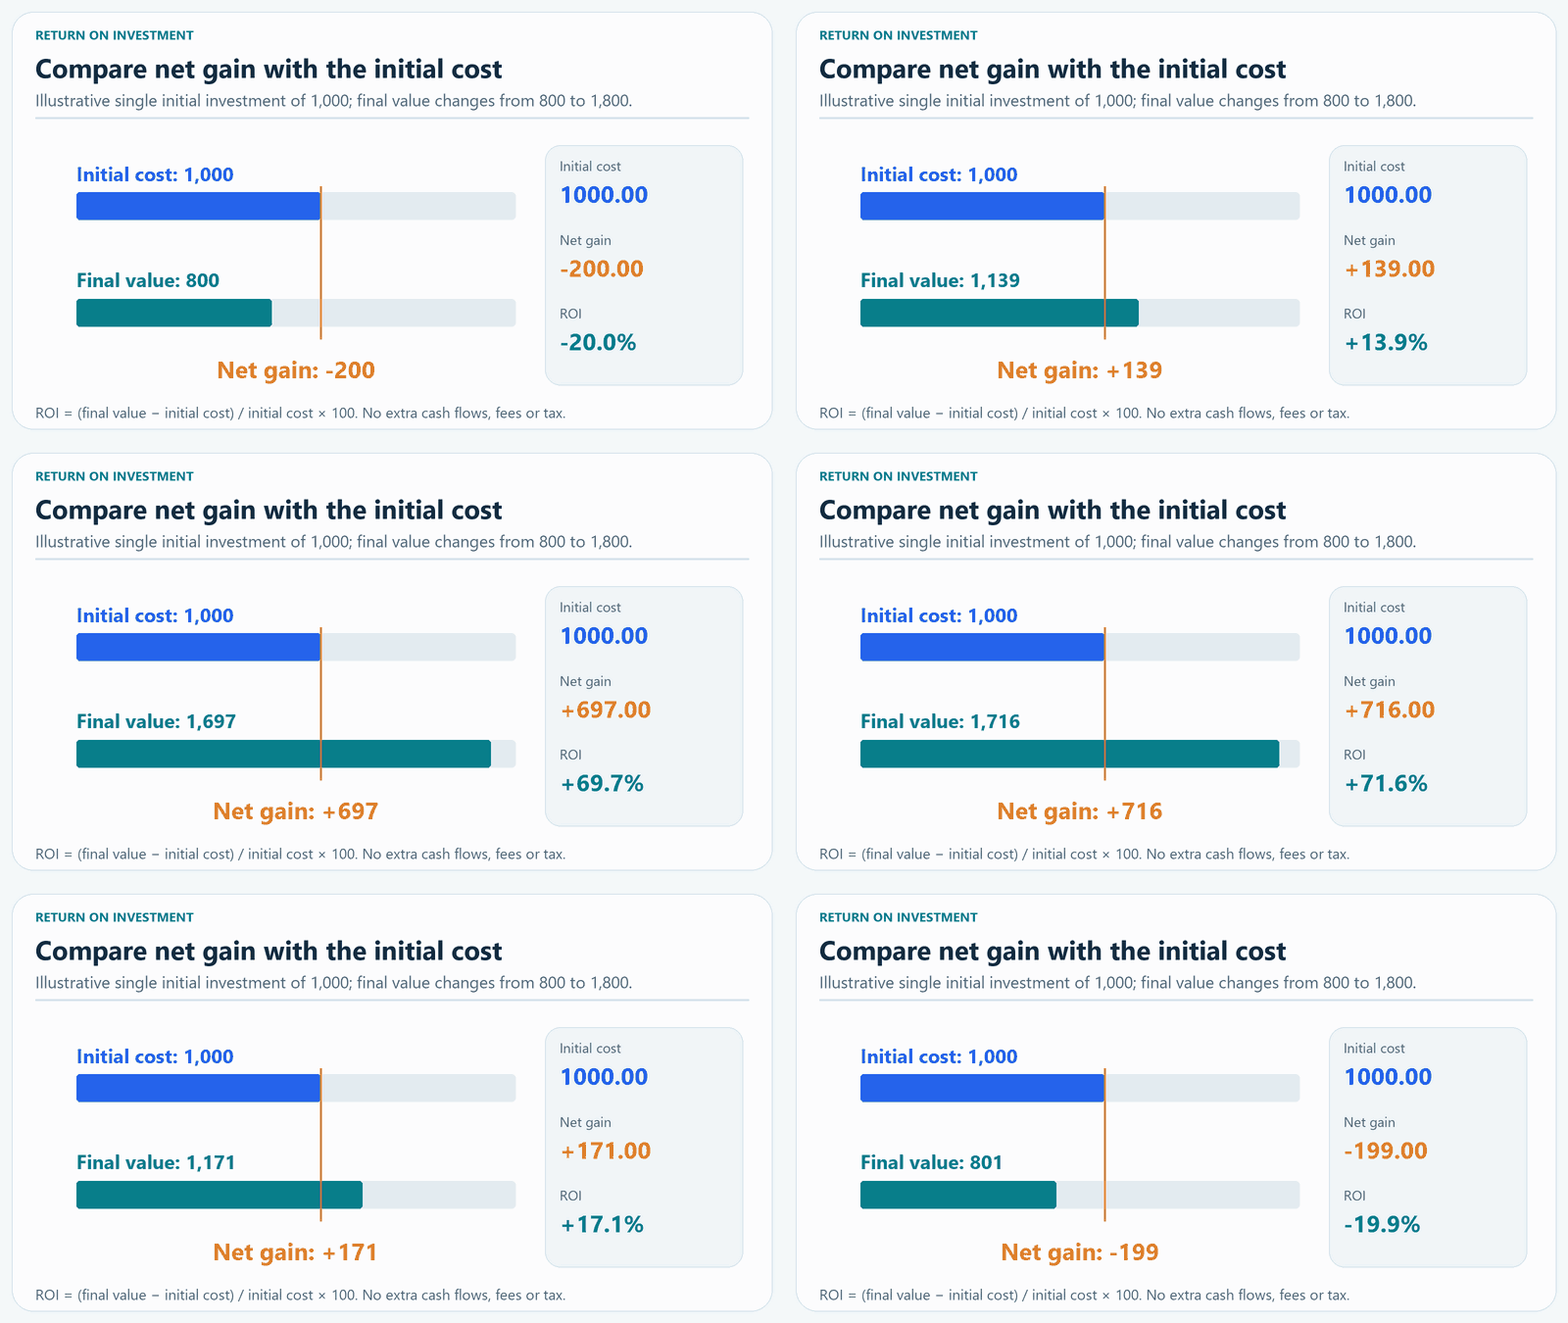
Compare net gain with the initial investment
Understand ROI, annualization and cash-flow timing
ROI measures profit relative to a stated cost basis. This calculator separates total-cost ROI from profit relative to initial investment. Annualization is a simplified start-to-end equivalence, not a straight division by years. The timed project calculates present value and recovery from actual entered cash flows. These are arithmetic models, not guaranteed returns or investment advice.
Calculation references
ROI questions
Why are there two return percentages?
Total-cost ROI divides profit by initial investment plus all additional costs. The initial-investment ratio divides the same profit by initial investment alone. The cost basis is stated so the two definitions are not confused.
Is annualized return just ROI divided by years?
No. The equivalent compounded annual rate uses a root of the ending-to-starting ratio. Here it assumes costs at the start and receipts at the end; interim flows require a timing-aware analysis.
Why is there no payback time for the simple totals?
Total receipts do not reveal when the money arrives. Enter timed cash flows to find the first actual scheduled recovery. If no recovery occurs within the entered horizon, the calculator does not invent a later date.
What does the discount rate change?
It changes the present value, NPV and discounted payback of timed cash flows. It does not change nominal profit, ordinary ROI or ordinary payback. The rate is an assumption, not a market quote.
Should I include the returned capital in receipts?
Yes, include all cash received, including a sale or final payout and any interim cash income. Do not count the same receipt twice. Marketing revenue alone is not profit; ROI requires costs, unlike a simple revenue-to-ad-spend ratio.
Does a higher ROI always mean the better investment?
No. Time, risk, capital needs, taxes, liquidity and the assumptions also matter. The comparison and scenarios are numerical illustrations, not recommendations.
Calculations run in your browser. The calculator does not send these inputs to its server or save them.