Lang
Math & Number Tools Calculator
Standard Deviation Calculator
Use this free Standard Deviation Calculator to calculate standard deviation with a cleaner layout, instant results, formulas, examples, and helpful interpretation notes.
Understanding Standard Deviation
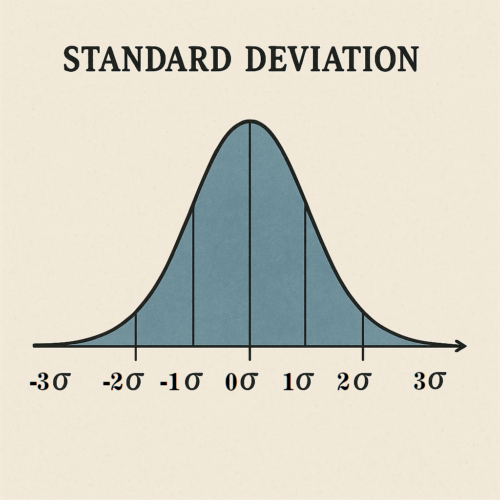
Standard deviation is a fundamental statistical measure that quantifies the amount of variation or dispersion in a set of values. It provides a sense of how spread out the data points are around the mean (average) value. A low standard deviation indicates that most of the data points cluster closely around the mean, whereas a high standard deviation indicates that the data points are more spread out.
Why Use a Standard Deviation Calculator?
A Standard Deviation Calculator simplifies the process of calculating statistical measures such as mean, variance, and standard deviation. This tool is particularly useful for researchers, data analysts, and students who need to perform statistical analysis quickly and accurately. By automating the calculations, it reduces the risk of human error and saves time.
How Does It Work?
The calculator computes the mean, variance, and standard deviation using the following formulas:
- Mean (\(\mu\)): The average of the data points. \[ \mu = \frac{1}{n} \sum_{i=1}^{n} X_i \]
- Variance (\(\sigma^2\)): The average of the squared differences from the mean. \[ \sigma^2 = \frac{1}{n} \sum_{i=1}^{n} (X_i – \mu)^2 \]
- Standard Deviation (\(\sigma\)): The square root of the variance. \[ \sigma = \sqrt{\sigma^2} \]
Example Usage
Suppose you have the following data points:
Data Points: 10, 12, 23, 23
Enter these values into the calculator to find the mean, variance, and standard deviation.
Interpreting Results
The calculator will provide the mean, variance, and standard deviation of the data set. For example:
    Mean: 17.00
    Variance: 42.00
    Standard Deviation: 6.48
This indicates that the data points are centered around 17.00 with a spread of approximately 6.48 units.
Mathematical Derivation
To derive the mean, variance, and standard deviation, follow these steps:
- Calculate the Mean (\(\mu\)): \[ \mu = \frac{10 + 12 + 23 + 23}{4} = 17.00 \]
- Calculate the Variance (\(\sigma^2\)): \[ \sigma^2 = \frac{(10-17)^2 + (12-17)^2 + (23-17)^2 + (23-17)^2}{4} = \frac{49 + 25 + 36 + 36}{4} = \frac{146}{4} = 36.50 \]
- Calculate the Standard Deviation (\(\sigma\)): \[ \sigma = \sqrt{36.50} \approx 6.04 \]
Applications of Standard Deviation
Standard deviation is widely used in various fields due to its ability to provide insights into the variability of data. Some common applications include:
- Finance: Assessing risk and volatility in investment portfolios. Standard deviation is used to measure the historical volatility of an asset, which helps investors understand the potential range of returns.
- Quality Control: Monitoring product quality and consistency. In manufacturing, standard deviation helps identify whether a process is producing products within acceptable limits.
- Education: Evaluating test scores and performance. Teachers and administrators use standard deviation to understand the distribution of student scores and identify outliers.
- Science: Analyzing experimental data. Scientists use standard deviation to determine the reliability and precision of their measurements.
Detailed Example in Finance
In finance, standard deviation is often used to measure the volatility of stock prices. Suppose you have the following daily returns of a stock over a week:
Daily Returns: 0.01, -0.02, 0.03, 0.02, -0.01, 0.00, 0.02
First, calculate the mean of the returns:
\[ \mu = \frac{0.01 + (-0.02) + 0.03 + 0.02 + (-0.01) + 0.00 + 0.02}{7} = \frac{0.05}{7} \approx 0.0071 \]Next, calculate the variance:
\[ \sigma^2 = \frac{(0.01 – 0.0071)^2 + (-0.02 – 0.0071)^2 + (0.03 – 0.0071)^2 + (0.02 – 0.0071)^2 + (-0.01 – 0.0071)^2 + (0.00 – 0.0071)^2 + (0.02 – 0.0071)^2}{7} \] \[ \sigma^2 = \frac{(0.0029)^2 + (-0.0271)^2 + (0.0229)^2 + (0.0129)^2 + (-0.0171)^2 + (-0.0071)^2 + (0.0129)^2}{7} \] \[ \sigma^2 = \frac{0.00000841 + 0.00073441 + 0.00052441 + 0.00016641 + 0.00029241 + 0.00005041 + 0.00016641}{7} \approx 0.0002496 \]Finally, calculate the standard deviation:
\[ \sigma = \sqrt{0.0002496} \approx 0.0158 \]This indicates that the daily returns have a standard deviation of approximately 0.0158, suggesting a moderate level of volatility.
Advantages of Using Standard Deviation
Some key advantages of using standard deviation include:
- Simplicity: Easy to understand and interpret. Standard deviation provides a straightforward measure of variability that is easy to communicate.
- Relevance: Provides meaningful insights into data distribution. It helps identify the spread and central tendency of data, which is crucial for making informed decisions.
- Comparability: Allows comparison of variability across different datasets. Standard deviation can be used to compare the variability of different sets of data, even if they have different means.
- Foundation for Further Analysis: Serves as a foundation for more advanced statistical analyses. Many statistical tests and models rely on standard deviation as a key parameter.
Final notes
The Standard Deviation Calculator is a powerful tool for anyone looking to perform statistical analysis. By providing quick and accurate results, it simplifies data analysis and helps in making informed decisions based on statistical measures. Whether you’re analyzing financial data, conducting scientific experiments, or evaluating educational outcomes, understanding and applying standard deviation can greatly enhance your analytical capabilities.
How to use this calculator
- Enter the values requested by the Standard Deviation Calculator.
- Use the optional fields when they match your real situation.
- Read the result, then compare it with the formula notes and examples below.
Accuracy tips
- Keep intermediate values visible when possible so you can spot typing mistakes.
- Use the examples to confirm whether the calculator expects percentages, decimals, or whole numbers.
- If the answer is used for school or work, round only after the final calculation.
Why this helps
- Designed for quick math & number tools checks with a focused input area.
- Helpful explanations are kept on the same page so the result is easier to understand.
- The page can be edited directly from the synced WordPress HTML file.
Compare two variables
Standard deviation describes spread in one data set. For paired x-y values, use the Correlation Coefficient Calculator.
Standard Deviation Calculator FAQ
How do I use the Standard Deviation Calculator?
Fill in the fields in the Standard Deviation Calculator, then press the calculate button or update the inputs to see the result.
Are the Standard Deviation Calculator results accurate?
The result is an estimate based on the values you enter. It is useful for planning and checking, but important decisions should be verified with the original data or a qualified professional.
Can I use the Standard Deviation Calculator on mobile?
Yes. The updated layout uses larger inputs, clearer spacing, and responsive cards so the Standard Deviation Calculator works on phones, tablets, and desktop screens.
Why does this page include formulas and examples?
Formulas and examples make the result easier to audit, help users learn the calculation, and improve the page for search engines without relying on Elementor.
Math & Statistics directory
Need another math or statistics tool?
Browse the full math and statistics calculator collection for percentages, algebra, geometry, probability, z-scores, confidence intervals, regression, correlation, percentiles, matrices, and number conversions.